Current Trends and Topics on Air Quality in Memphis
By Weather and Climate Expert John Bryant
Introduction
Memphis air quality is tracked by EPA-designated monitors operated by the Shelby County Health Department, including a key ozone monitor in the urban core that reports data into EPA’s Air Quality System (AQS). Data is also summarized in EPA and ALA reports. Recent data show repeated exceedances of the current 8-hour ozone standard of 70 ppb on hot summer afternoons, even as fine particulate matter (PM2.5) levels generally remain below EPA’s annual standard. If ozone levels remain elevated, Memphis could be at risk of an official ozone non-attainment designation, which would require enforceable emission-reduction plans and tighter permitting under the Clean Air Act.
A weather and climate expert applies atmospheric science to understand, forecast, reconstruct, and explain atmospheric conditions and their impacts.
| Location | Memphis Metro / Shelby County, Tennessee (CONUS Southeast) |
|---|---|
| Time Window | Summer ozone season (May–Sept, peak June–Aug); Monitoring period 2019–2021 data, 2025 alerts |
| Max Ozone (8-hr) | Exceeded EPA standard of 70 ppb on multiple summer days (Shelby County monitors) |
| Unhealthy Days | Multiple Code Orange and occasional Code Red ozone days over the 2019–2021 period, based on EPA Air Quality Index categories |
| Data Sources | EPA AirNow, NOAA NWS, American Lung Association State of the Air 2025, Shelby County Health Dept |
| Confidence | High (multiple federal monitors, peer-reviewed ALA analysis, EPA-verified AQI) |
Evidence and Methods
Ozone Monitoring Network
As noted above, Memphis air quality is tracked by EPA-designated monitors operated by the Shelby County Health Department. Data flows to EPA AirNow in real-time and is archived in the federal Air Quality System (AQS) database.
Key dataset: EPA Air Quality System (AQS) database, accessed via AirNow.gov and EPA’s annual summaries. The American Lung Association analyzes three years of rolling data (2019–2021 for the 2025 report) to calculate weighted averages and grade counties.
Ozone formation mechanism: Ground-level ozone (O₃) is not directly emitted. It forms when NOx and VOCs—primarily from vehicle exhaust, industrial combustion, and fuel evaporation—react in sunlight. Peak ozone occurs on hot afternoons (typically 2–6 PM CDT) when solar radiation is strongest and temperatures exceed 90°F.
Particle Pollution (PM2.5)
Fine particulate matter (PM2.5) in Memphis is measured at multiple sites, and recent annual averages have remained below EPA’s 12 μg/m³ standard, with few if any 24-hour readings above the 35 μg/m³ short-term standard.
Exception: In June 2023, Canadian wildfire smoke transported into the Mid-South temporarily pushed PM2.5 into at least the moderate to unhealthy range on some days, an example of how distant fires can briefly worsen local air quality.
Regional Climate Context
NOAA climate data show that Memphis has warmed compared to 20th-century averages, with more frequent very hot summer days in recent decades. In many urban areas, hotter and more stagnant summer conditions are associated with higher ozone levels because photochemical reactions proceed more quickly and pollutants disperse less efficiently.
Limitations
- Spatial gaps: Monitors capture central Memphis well; neighborhoods in Southwest Memphis (industrial corridor) have less coverage. Community air sensors provide supplemental data but lack EPA certification.
- Temporal resolution: 8-hour ozone averages smooth peak 1-hour spikes, which can exceed 100 ppb briefly.
- Source apportionment: While NOx inventories exist, real-time attribution of specific emission sources to daily ozone levels requires atmospheric modeling (CMAQ or CAMx), not direct measurement.
- Transboundary pollution: Ozone precursors can travel 100+ miles downwind. Memphis receives contributions from upwind states (Arkansas, Mississippi) that local controls alone cannot eliminate.
Mechanism and Attribution
Synoptic Pattern
Memphis ozone episodes correlate with Bermuda High expansion. This high-pressure system brings subsiding air, clear skies, and light winds to the Mid-South. Surface analysis shows typical 850-mb ridge centered over Arkansas/Tennessee during peak ozone days.
June 7, 2025 example: NWS surface analysis (12Z) showed a quasi-stationary front north of Memphis. South winds 5–10 mph, clear skies, maximum temperature 96°F. These conditions trap emissions and maximize photochemical ozone production.
Emission Sources (NOx and VOC)
- Mobile sources (vehicles, aircraft): These sources are estimated to contribute the largest share of regional NOx, particularly from highway freight and aircraft operations at Memphis International Airport.
- Industrial point sources: Large industrial and energy facilities in the Memphis area account for a substantial portion of remaining NOx emissions.
- Area sources: Smaller sources such as lawn equipment, consumer products, and small engines contribute additional NOx and VOCs on a more diffuse basis.
VOCs come primarily from gasoline evaporation and vehicle exhaust. Memphis’s role as a petroleum distribution hub (refineries, tank farms) adds localized VOC emissions.
Climate Amplification
Higher baseline temperatures are associated with higher ozone levels in many cities, with studies showing that extreme heat days often coincide with elevated ozone. Recent “State of the Air” reports highlight that ozone pollution has worsened in many U.S. communities, and Memphis continues to experience repeated high-ozone days during hot, stagnant weather.
Practical Implications
These air quality trends are not just academic—they have direct implications for litigation, insurance claims, and regulation in Memphis.
Liability and Causation
For premises liability, workers’ compensation, or environmental litigation: Documented high-ozone days establish exposure. If a plaintiff experienced an asthma attack on June 7, 2025, the Code Orange alert (issued by Shelby County Health Dept at 9 AM CDT) is admissible evidence that air quality was hazardous. Employers or property owners in outdoor work settings may face heightened duty-of-care arguments on air quality alert days.
Insurance Claims
Commercial general liability policies may address “pollution events.” If a business’s operations contributed measurably to a localized ozone spike (e.g., unpermitted emissions), claims could arise. Environmental consultants should review emissions inventories and air permits.
Regulatory Triggers
Given its ozone levels and “F” grade, Memphis is at risk of an ozone non-attainment designation if high concentrations persist, which would trigger enforceable emission-reduction requirements under the Clean Air Act. This would require:
- State Implementation Plan (SIP) with enforceable emission reductions
- New Source Review for industrial expansions
- Transportation conformity analysis for federal highway projects
- Potential economic impacts: stricter permitting, delayed project approvals
Public Health Costs
Ozone-related health impacts—such as asthma attacks, emergency room visits, and lost workdays—impose significant economic costs on communities the size of Memphis, although precise dollar amounts depend on the underlying health-impact and cost assumptions used in each study.
Regional Differences
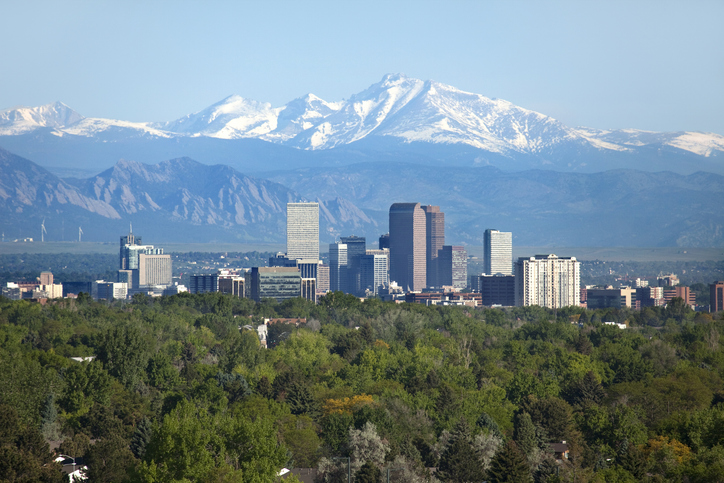
Cities across the country face similar challenges in different ways. For example, Denver has struggled with frequent unhealthy ozone days related in part to its elevation and nearby oil and gas development, while some Tennessee Valley cities such as Chattanooga and Nashville generally report fewer unhealthy ozone days than Memphis. Gulf Coast (Mobile, New Orleans): Higher humidity moderates ozone formation slightly, but similar industrial sources exist.
Frequently Asked Questions About Memphis Air Quality
What is ground-level ozone and why is it harmful?
Ground-level ozone is a secondary pollutant formed when NOx and VOCs react in sunlight. It inflames lung tissue, triggers asthma, and worsens COPD. Healthy adults can experience reduced lung function after 6–8 hours of moderate exertion on Code Orange days.
How does Memphis compare to other cities for air quality?
According to recent “State of the Air” reports, Memphis ranks among the more polluted U.S. metro areas for ozone, though cities like Los Angeles and Houston still experience more severe ozone problems overall. For PM2.5, Memphis performs better—many Western cities battling wildfire smoke have worse particle pollution.
What does non-attainment mean for Memphis?
Non-attainment is an EPA designation for areas violating National Ambient Air Quality Standards. It triggers mandatory pollution reduction plans, stricter permits, and potential loss of federal highway funds if standards are not met. Given its ozone levels and “F” grade, Memphis is at risk of an ozone non-attainment designation if high concentrations persist.
Can I check air quality before outdoor activities?
Yes. Visit AirNow.gov or download the EPA AirNow app. Enter Memphis, TN. The Air Quality Index (AQI) color codes risk: Green (good), Yellow (moderate), Orange (unhealthy for sensitive groups), Red (unhealthy for all). Plan strenuous outdoor exercise on Green or Yellow days.
Who enforces air quality standards in Memphis?
Shelby County Health Department monitors and enforces local rules. Tennessee Department of Environment & Conservation (TDEC) oversees state permits. EPA sets national standards and can mandate compliance if state/local efforts fall short.
What are sensitive groups in air quality warnings?
Children (lungs still developing), elderly (age 65+), people with asthma, COPD, heart disease, and pregnant women. These groups experience health effects at lower pollution levels than healthy adults. Memphis has disproportionately high pediatric asthma rates in South and North Memphis neighborhoods.
Key Takeaways
- Memphis exceeds EPA ozone standards: Peak 8-hour ozone concentrations at Shelby County monitors have exceeded the EPA standard of 70 ppb on multiple summer days in recent years.
- Primary cause: NOx and VOC emissions from vehicles, industrial facilities, and refineries, amplified by heat and stagnant weather.
- Health impact: Memphis is consistently ranked among the top U.S. “Asthma Capitals,” reflecting high asthma burden and vulnerability to ozone and other pollutants.
- Regulatory status: At risk of non-attainment designation if ozone levels remain elevated, which would mandate enforceable controls.
Need expert forensic meteorology analysis for air quality litigation or environmental claims?
Contact John Bryant for a free case review: [email protected] | 901.283.3099 | weatherandclimateexpert.com/contact
Technical Appendix
Datasets
- EPA Air Quality System (AQS): Federal database of criteria pollutant measurements. Memphis data from Shelby County monitors. Retrieved via AirNow API.
- American Lung Association State of the Air 2025: Peer-reviewed analysis of 2019–2021 AQS data, published April 2025. Methodology weights unhealthy days and calculates design values per EPA guidance.
- NOAA NCEI Climate Data Online: Temperature, precipitation, and drought indices for Memphis International Airport (KMEM).
- Shelby County Health Dept Air Quality Bulletins: Historical Code Orange alerts, archived at shelbycountytn.gov/airquality.
Quality Control and Uncertainty
EPA-certified monitors undergo regular calibration and quality-assurance checks to ensure that observed ozone and PM2.5 levels meet federal data-quality requirements. While forecast models and satellite products can provide useful context, this article relies on observed monitoring data and published summaries as the primary basis for conclusions.
- Confidence bins: High confidence for ozone (multiple certified monitors, 20+ years of continuous data). Medium confidence for source attribution (requires inverse modeling). Low confidence for hyperlocal PM2.5 in industrial corridors (monitor spacing ~5 miles).
Chain of Custody
Datasets: EPA AQS (Shelby County monitors), NOAA NCEI KMEM, ALA State of the Air 2025, Shelby County Health Dept bulletins
Tools: EPA AirNow API, NOAA NWS API
File integrity: SHA-256 hashes available upon request for raw data files
Uncertainty statement: Measurement uncertainty for ozone and PM2.5 is small compared with the size of the exceedances discussed here. Source attribution modeling carries additional uncertainty due to emission inventory gaps and meteorological variability.
Conclusion
Improving air quality in Memphis is both a challenge and a necessity. The data and trends up to mid-2025 reveal that while progress has been made—notably in cutting industrial emissions and keeping particle levels in check—ozone pollution remains a critical issue undermining public health.
Memphis’s struggle with smog is multifaceted. Geography and climate provide the backdrop for pollution to accumulate, a robust transport and industrial economy contributes emissions, and climate change is raising the stakes with hotter, drier summers. At the same time, the city’s status as an “Asthma Capital” and the environmental justice concerns in overburdened neighborhoods make it clear that clean air is not just an environmental goal, but a moral and public health imperative.
On a positive note, Memphis and Shelby County are not facing these problems idle. Through people-first initiatives (rideshares, anti-idling, EV infrastructure) and potential regulatory actions, the community is actively seeking solutions. The engagement of journalists, policymakers, and residents is crucial. By fostering awareness and using accurate, expert-reviewed information, we strengthen the city’s capacity to demand and deliver change.
In conclusion, ensuring healthy air in Memphis will require sustained effort, science-based policy, and community involvement. It means balancing economic growth with environmental responsibility, and learning from both data and lived experience. Armed with knowledge of current trends and topics in Memphis air quality, decision-makers and citizens alike can push for a future where every breath in Shelby County is a safe one.
About the Author
John Bryant is a distinguished forensic meteorologist with 30+ years of specialized experience in weather analysis and reconstruction, as well as expert witness testimony. He holds the rare global distinction of triple certification by the American Meteorological Society (AMS), the National Weather Association (NWA), and the Environmental Protection Agency (EPA). He is recognized as one of the few meteorologists worldwide to hold all three certifications concurrently, a credential that underscores his unmatched expertise in forensic weather reconstruction and regulatory compliance.
Mr. Bryant provides authoritative expert testimony and forensic weather reconstruction for high-stakes litigation on behalf of both defense and plaintiff. He has created meteorological reports used to support legal arguments at deposition and trial, and he has served as a pivotal expert in wrongful death and personal injury cases on both sides, where his foundational meteorological analysis shaped legal strategies and case outcomes. His expert report in a two-million-dollar case involving extreme weather conditions resulted in a favorable settlement for the client.
He consults closely with legal teams to translate complex atmospheric data into clear, accessible narratives that help judges and juries understand how weather conditions affected specific facts in a case. His ability to communicate technical weather science in plain language is central to the value he brings to litigation support.
Mr. Bryant holds a B.S. in Geosciences with an emphasis in Meteorology and Atmospheric Science from Mississippi State University. He previously served as Chief Meteorologist at an ABC affiliate station in Memphis for over a decade, where he directed a professional meteorological team and worked with regional emergency management services during severe weather events, including hurricanes, tornadoes, and winter storms. He has also collaborated with a NOAA team to audit and refine AI-driven weather models, conducting rigorous assessments of predictive technologies for weather-sensitive sectors.
Need Expert Weather or Climate Analysis for Your Case?
Use the contact form below or email me for a free case review.
John Bryant – Forensic Meteorologist
Forensic Meteorology Resources
Weather Data & Research:
- National Oceanic and Atmospheric Administration (NOAA)
- National Weather Service
- National Centers for Environmental Information
- EPA AirNow – Real-Time Air Quality
Professional Organizations:
National Expert Witness Services:
- Weather and Climate Expert Consulting LLC – Forensic meteorology services for attorneys nationwide
The author of this article is not an attorney. This content is meant as a resource for understanding forensic meteorology. For legal matters, contact a qualified attorney.
Sources
- American Lung Association. (2025). State of the Air 2025: Memphis MSA Data. lung.org
- Action News 5. (2025, June 7). Memphis receives second straight “F” grade for ozone pollution. actionnews5.com
- NOAA National Centers for Environmental Information (NCEI). (2025). Climate Data Online. ncei.noaa.gov
- EPA AirNow. (2025). Real-Time Air Quality Index: Memphis. airnow.gov
- Tennessee Department of Environment & Conservation (TDEC). (2025). Air Pollution Control Division Reports. tn.gov
- Shelby County Health Department. (2025). Path Forward: Ozone Reduction Programs. shelbycountytn.gov