How Do Forensic Meteorologists Rebuild the Wildfire Weather Record?
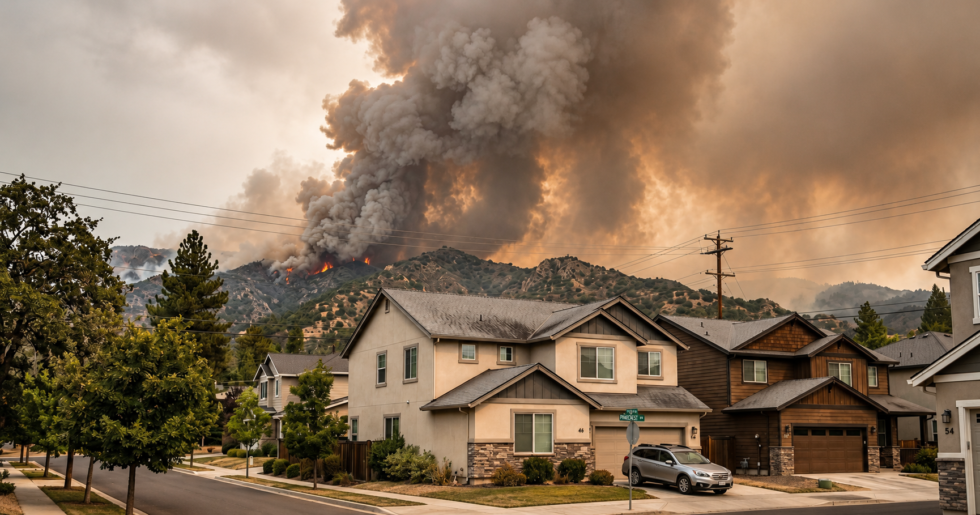
Wildfire smoke damage litigation depends on a defensible atmospheric record of how the fire and smoke evolved over time.
Last Reviewed May 2026
John Bryant is an AMS, NWA, and EPA-certified forensic meteorology expert witness specializing in weather reconstruction for slip-and-fall, wind, hail, wildfire, and ice-storm litigation.
Case-Type Applicability
This analysis applies to the following litigation types:
- Wildfire origin and spread (utility company, arson, and negligence claims)
- Smoke damage to property (residential, commercial, agricultural)
- Personal injury from smoke inhalation and chronic respiratory exposure
- Insurance coverage disputes over fire weather conditions
- Evacuation timing and duty-of-care claims
- Air quality liability (PM2.5 and PM10 exposure documentation)
- Utility subrogation cases involving transmission equipment and wind conditions
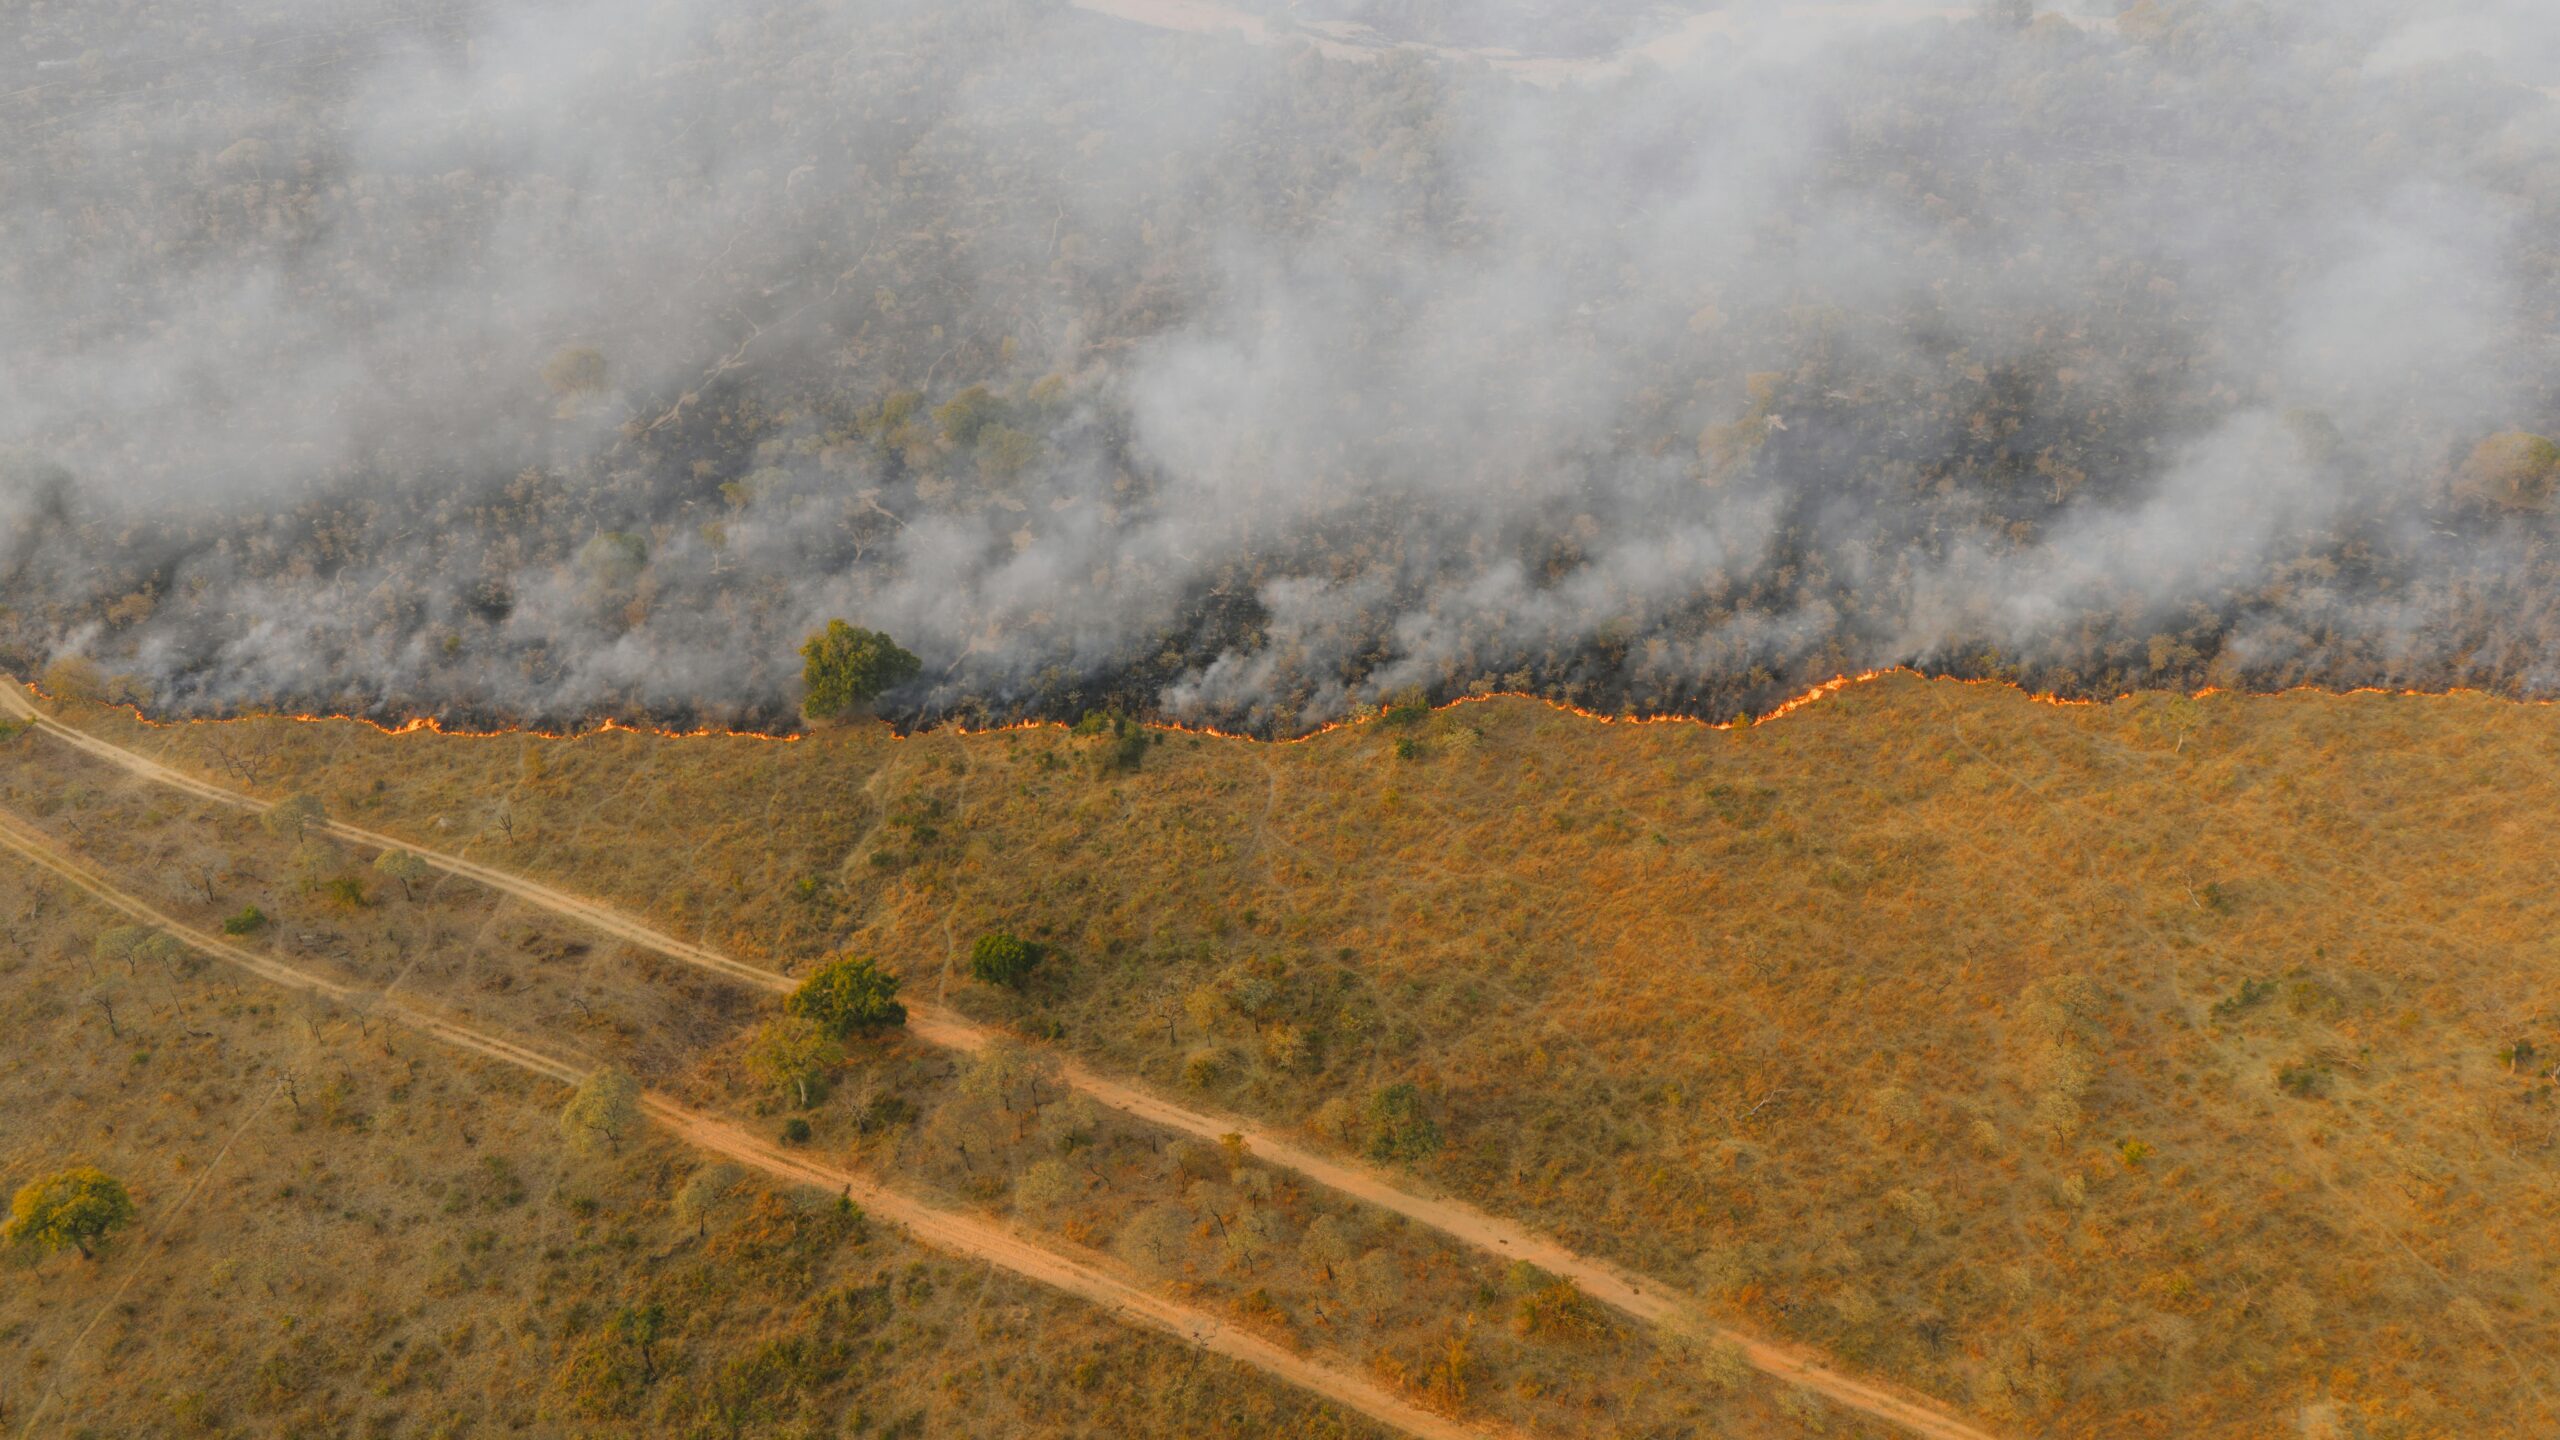
Why Does Wildfire Litigation Require a Forensic Atmospheric Record?
Because the atmospheric record of any wildfire event is permanently preserved in independently maintained federal archives and does not depend on any party’s account of conditions. A forensic meteorologist retrieves that record systematically, producing source-documented, timestamped evidence of wind speed, humidity, smoke transport, and air quality for any historical date and location.
Unlike proprietary commercial weather datasets, federal weather archives are maintained under independent quality assurance standards, timestamped at the moment of observation, and publicly accessible to any party. They are not subject to retroactive correction by an entity with an interest in the litigation outcome. The analysis begins with the atmospheric synoptic setup, proceeds through mesoscale fire weather conditions, documents smoke transport and concentration, and produces a verified timeline aligned with known incident facts.
For any major wildfire event, the atmospheric record is complete, publicly archived, and reconstructable. The question is whether your side obtains and interprets it first (NOAA NCEI; NIFC).
What Do the 7 Key Federal Datasets Contain for Wildfire Reconstruction?
The 2025 Palisades and Eaton fires burned 59 square miles of Los Angeles County in under 14 hours under Santa Ana wind gusts of 70 to 100 mph documented by NWS Los Angeles. Every meteorological fact in that sentence is retrievable from at least one of seven independently maintained federal archives. The table below identifies each dataset for the Palisades event as an illustrative reference.
| Parameter | Documented Value | Primary Data Source | Confidence |
|---|---|---|---|
| Event Location | Pacific Palisades / Altadena, Los Angeles County, CA | LAFD Incident Records; NIFC | HIGH |
| Fire Ignition Date | January 7, 2025 | NWS Los Angeles (LOX); LAFD | HIGH |
| NWS Red Flag Warning Issued | January 6, 2025 (24+ hrs before ignition) | NWS LOX / IEM Mesonet Archive | HIGH |
| SPC Critical Fire Wx Outlook | 70% probability of simultaneous critical wind, low RH, dry fuels | Storm Prediction Center, Norman OK | HIGH |
| Peak Wind Gusts (NWS documented) | 70 to 100 mph (Santa Monica Mountains) | NWS-LOX; RAWS Network | HIGH |
| Total Area Burned | 59 square miles / 37,760+ acres (combined) | NIFC Incident Management Situation Report; CAL FIRE | HIGH |
| Structures Destroyed | 16,246 | CAL FIRE | HIGH |
| Primary WSR-88D Radar | KVTX (Ventura, CA) | NOAA NCEI Level II Archive | HIGH |
| ASOS Reference Station | KLAX (Los Angeles International) | NOAA NCEI Integrated Surface Database | HIGH |
| Smoke Transport Model | HYSPLIT with archived NAM/GDAS meteorological fields | NOAA Air Resources Laboratory (arl.noaa.gov) | HIGH |
| Active Federal Litigation Status | Lawsuits cleared to proceed; LA Superior Court (Feb 2026) | Court records; NBC Los Angeles reporting | HIGH |
Those 7 datasets are: the RAWS network (NIFC/WRCC), NWS warning products (IEM archive), upper-air sounding data (University of Wyoming), WSR-88D Level II radar (NOAA NCEI), NOAA HYSPLIT trajectory and dispersion model (NOAA ARL), NOAA HMS satellite fire and smoke analysis (NOAA OSPO), and EPA AirNow/AQS monitoring records (EPA aqs.epa.gov).
What Does a Wildfire Smoke Damage Expert Witness Reconstruct for Litigation?
A wildfire smoke damage expert witness addresses four distinct litigation theories, each requiring a different subset of the atmospheric record. Utility subrogation cases ask whether documented wind conditions at a specific location and time are consistent with transmission equipment failure. Wrongful death and premises liability cases examine whether atmospheric warnings issued before a fire were documented, and whether spread conditions were consistent with available evacuation time.
Smoke exposure personal injury cases ask whether PM2.5 concentrations at a specific address crossed an EPA health threshold on a specific date. Property damage disputes ask whether smoke was transported to a structure and whether documented wind direction is consistent with the damage pattern. None of these questions can be answered from a commercial weather app or vendor-supplied weather report.
Each requires forensic analysis of federal government data, maintained under independent quality assurance standards, timestamped at the moment of observation, and permanently archived in publicly accessible repositories (NOAA NCEI; EPA AQS; NIFC).
How Do RAWS Stations Document Fire Weather Conditions at the Event Site?
The Remote Automated Weather Station (RAWS) network operates approximately 2,200 stations across fire-prone landscapes, recording wind speed, direction, temperature, relative humidity, and fuel moisture at hourly or sub-hourly intervals. Data are transmitted via GOES satellite to NIFC in Boise, Idaho, and archived at the Western Regional Climate Center (WRCC) in Reno, Nevada, at wrcc.dri.edu (NIFC; WRCC; WIFIRE Commons Data Catalog).
RAWS stations carry a decisive advantage over standard ASOS airport stations in fire weather analysis. RAWS are deliberately sited in terrain that experiences actual fire weather conditions: ridgelines, canyon exits, and chaparral slopes where terrain-channeled wind acceleration and sharp humidity gradients drive fire behavior. An airport ASOS station three miles from a fire may record sustained winds of 25 mph while a nearby RAWS on an exposed ridgeline records gusts of 65 mph. That difference is not a data discrepancy. It is a physical reality of terrain-driven wind systems, and explaining that difference to a jury is a core function of fire weather expert testimony.
RAWS wind sensors are mounted at 6 meters (20 feet) above ground; temperature and relative humidity sensors are at 2 meters. For any western U.S. wildfire, the RAWS archive satisfies federal QA/QC standards and is independently retrievable by either party (WRCC; NIFC RAWS portal).
What NWS Fire Weather Products Are Available Before a Wildfire Starts?
The NWS issues two primary fire weather decision-support products with direct litigation relevance: Storm Prediction Center (SPC) Fire Weather Outlooks at 24-hour and 48-hour lead times, and local Red Flag Warnings issued by individual Weather Forecast Offices. Both products are permanently archived at the Iowa Environmental Mesonet at mesonet.agron.iastate.edu, retrievable by product type, WFO, and issuance timestamp (IEM Mesonet Archive; SPC Archive).
The SPC Fire Weather Outlook carries probabilistic language, including “critical” and “extremely critical” designations that quantify the probability of simultaneous dangerous fire weather at a regional scale. For the January 2025 Palisades event, the SPC documented a 70% probability of simultaneous critical wind, low relative humidity, and dry fuels more than 48 hours before ignition.
Red Flag Warning criteria are locally defined by NWS Weather Forecast Offices and state fire-weather operating plans. Common criteria include low relative humidity, strong sustained winds or frequent gusts, dry fuels, and sometimes dry thunderstorms, but the applicable threshold must be verified for the specific WFO, fuel zone, and event date (NWS product archive). For the January 2025 Palisades event, NWS LOX issued a Red Flag Warning on January 6, more than 24 hours before ignition, with forecast peak gusts of 80 mph in the Santa Monica Mountains. That warning text, its issuance time, and its geographic polygon are all retrievable from the IEM archive.
How Do Terrain-Driven Winds and Wind Shifts Factor Into Fire Spread Reconstruction?
Santa Ana, Diablo, and downslope wind events share a common meteorological mechanism: adiabatic compression and warming as air descends from elevated terrain, with relative humidity falling to critically low levels. Wind speed and direction at the moment of ignition and during critical spread are reconstructed from RAWS 10-minute records, ASOS/AWOS hourly observations, and WSR-88D Level II radar velocity data from the nearest operational site.
The physical mechanism begins with a high-pressure system over the Great Basin or interior West. Air descends through mountain passes and canyon corridors, undergoing adiabatic warming at approximately 5.5 degrees Fahrenheit per 1,000 feet of descent. The descending air simultaneously dries. Fine dead fuel moisture falls to critically low levels. NOAA’s GOES-16 and GOES-18 satellites capture these wind events and resulting fire plumes at 10-minute intervals, archived at the NOAA Comprehensive Large Array-Data Stewardship System (CLASS) at class.noaa.gov (NOAA GOES Archive).
Wind shifts are among the most legally complex fire behavior questions. When prevailing surface wind direction rotates abruptly, the flank of an active fire becomes its new head. Long-range spotting can ignite new fires a mile or more ahead of the main perimeter within seconds. The NWS ASOS network and RAWS archive document exactly when and where wind shifts occurred relative to a fire perimeter. WSR-88D Level II data from the nearest radar site can further document pyroconvective columns and associated wind circulation patterns (NOAA NCEI; ncei.noaa.gov/products/radar).
For the 2025 Palisades fire, archived data from KVTX (Ventura, CA WSR-88D) documents the evolution of the pyroconvective plume over the Santa Monica Mountains beginning January 7, 2025, the day of ignition.
How Does Relative Humidity Affect Fire Spread and Fuel Condition Evidence?
Relative humidity is a primary variable controlling how readily available fuels will ignite and how rapidly fire will spread once ignited. The National Fire Danger Rating System (NFDRS), used operationally by the U.S. Forest Service and NWS, calculates fine dead fuel moisture as a function of temperature, relative humidity, and recent precipitation history, with all necessary inputs available from archived RAWS data (USDA Forest Service NFDRS documentation; WRCC).
Low relative humidity promotes drying of fine dead fuels, especially 1-hour fuels such as grasses, needles, and leaf litter. RAWS 10-hour fuel moisture can provide additional context, but it should not be treated as the direct moisture class for all fine fuels. The applicable threshold for what constitutes critically dry fine fuels should be evaluated by fuel type, local fire-danger operating plan, NFDRS context, season, and regional climatology.
The Rothermel fire spread model, the standard spread algorithm used operationally by federal fire management agencies, uses documented relative humidity and fuel moisture as primary inputs. An opposing expert who claims fire could not have spread to a disputed property under documented weather conditions must contend with NFDRS fine fuel moisture values calculated from archived RAWS inputs for that specific day (USDA Forest Service).
How Does HYSPLIT Evaluate Smoke Transport for Property and Personal Injury Claims?
NOAA’s Hybrid Single-Particle Lagrangian Integrated Trajectory model (HYSPLIT), developed by the Air Resources Laboratory, evaluates whether modeled air parcels or dispersion pathways are consistent with source-to-receptor smoke transport. Concentration estimates require additional inputs including emissions assumptions, plume height, particle behavior, model configuration, and comparison with ground-based PM2.5/PM10 observations (NOAA ARL; Stein et al., 2015).
HYSPLIT is equally capable of forward trajectory analysis, tracing where a smoke plume traveled from a fire, and backward trajectory analysis, tracing where air at a receptor location originated. For wildfire smoke litigation, HYSPLIT is typically run using archived NAM or GDAS meteorological fields, which represent the best available reconstruction of the atmosphere at the time of the fire. HYSPLIT is the same model used operationally by NOAA’s National Centers for Environmental Prediction (NCEP) for public smoke forecast products and has been extensively peer-reviewed in atmospheric science literature including validation studies using the 2018 Camp Fire (NOAA ARL READY archive; ready.noaa.gov).
For property damage and personal injury claims, smoke presence and smoke concentration must both be documented. AirNow can be useful for near-real-time or historical situational context, but EPA AQS is the appropriate source where official ambient air-quality records are required. Measured PM2.5 or PM10 concentrations should be cited by AQS monitor ID, EPA parameter code, averaging period, observation date and time, QA status where available, and retrieval date (EPA AQS database; aqs.epa.gov).
The EPA AQI scale defines medically significant exposure thresholds with direct relevance in personal injury contexts. An AQI between 101 and 150 is classified as “Unhealthy for Sensitive Groups.” An AQI between 151 and 200 is “Unhealthy.” An AQI between 201 and 300 is “Very Unhealthy.” An AQI above 300 is “Hazardous.” Each threshold is a regulatory standard under the Clean Air Act, 40 C.F.R. Part 50, not a contested expert opinion (EPA NAAQS PM2.5).
What Are Mixing Height and Ventilation Index in Smoke Concentration Cases?
Mixing height is the depth of the atmospheric layer above the surface within which active turbulent mixing occurs. The ventilation index is its mathematical product with transport wind speed. Low ventilation index values indicate that smoke is physically constrained near the surface; high values indicate rapid dispersal. NWS fire weather forecasts specify both variables and are archived at the Iowa Environmental Mesonet (IEM Mesonet Archive).
When mixing height falls below 1,500 feet above ground level, smoke produced by a fire is physically prevented from rising and dispersing freely. Pacific Coast marine inversion layers can suppress mixing heights below 1,500 feet for multiple consecutive days, producing sustained near-surface smoke accumulation across downwind communities. Radiosonde soundings, launched twice daily at 0000 and 1200 UTC from NWS upper-air stations and archived at weather.uwyo.edu/upperair, allow a forensic meteorologist to calculate mixing height and ventilation index for any historical fire event (University of Wyoming radiosonde archive).
In 2025, the National Wildfire Coordinating Group (NWCG) Fire Weather Subcommittee formally recommended discontinuing the Haines Index, a fire weather stability metric in operational use since 1988, after determining it is not supported by peer-reviewed research as a predictor of large fire growth. The NWCG identified mixing height as the operative replacement metric (NWCG Fire Weather Subcommittee; nwcg.gov). Expert testimony in current litigation that relies primarily on Haines Index values as evidence of atmospheric instability may be questioned on that basis.
How Does the Chain-of-Custody Data Protocol Support Daubert Compliance?
A defensible wildfire atmospheric reconstruction documents not only what the data show but where each dataset was retrieved, when, and under what quality assurance conditions. Every federal archive used in a forensic weather report should carry a retrieval date, archive URL, station or file identifier, and QA flag status. This documentation protocol is what differentiates a Daubert-compliant expert opinion from one vulnerable to challenge (FRE 702, 2023 amendments; Daubert v. Merrell Dow Pharmaceuticals, 509 U.S. 579 (1993); Kumho Tire Co. v. Carmichael, 526 U.S. 137 (1999)).
In my practice, I follow a seven-step data provenance protocol:
- Event Identification. Confirm fire name, ignition location, and ignition date against the NIFC Incident Management Situation Report and the relevant NWS WFO event summary.
- RAWS Data Retrieval. Download hourly meteorological records for all RAWS stations within relevant proximity from the WRCC archive at wrcc.dri.edu; document retrieval date, station identifiers, and QA flags.
- NWS Warning Product Retrieval. Retrieve Red Flag Warning texts, SPC Fire Weather Outlook products, and ASOS/AWOS observations from the IEM mesonet archive; document each product’s exact issuance timestamp.
- Radar Data Acquisition. Download Level II WSR-88D archive files for the relevant radar site (e.g., KVTX) from NOAA NCEI for the event period; document file names, scan times, and volume coverage patterns.
- Sounding Data Retrieval. Download 0000 and 1200 UTC radiosonde soundings from the nearest NWS upper-air station from the University of Wyoming archive; calculate mixing height and ventilation index for each sounding period.
- HYSPLIT Documentation. Execute HYSPLIT trajectory or dispersion runs using archived NAM or GDAS meteorological fields; record all model run parameters, input meteorological dataset versions, release height, and output file timestamps; retain all input and output files.
- Smoke and AQI Documentation. Retrieve EPA AQS hourly PM2.5 readings (parameter code 88101) for monitors within the NOAA HMS smoke extent boundary; download HMS smoke extent shapefiles for the event period from NOAA OSPO; retain all files with dated download logs.
How Does Evacuation Timing Analysis Work With the Federal Atmospheric Record?
The atmospheric component of evacuation timing is entirely documentable from federal archives with minute-level temporal resolution. The NWS Red Flag Warning timestamp establishes when the meteorological hazard was formally recognized and communicated; the SPC Fire Weather Outlook establishes when probabilistic guidance first indicated critical fire weather at the regional scale, up to 48 hours before event onset (IEM Mesonet Archive; SPC Archive).
NOAA’s GOES-16 and GOES-18 active fire detection products establish when fire pixels first appeared at a specific geographic location. NIFC Incident Management Situation Reports establish official fire acreage and perimeter growth estimates at each reporting period. RAWS and ASOS station data establish the hour-by-hour progression of wind gusts, relative humidity decline, and temperature rise through the event.
These datasets can be assembled into a chronological atmospheric timeline that shows, to the hour, what meteorological information was in the official public record before, during, and after a fire event. For the January 2025 Palisades event, the NWS Red Flag Warning was on the public record 24 hours before ignition; the SPC critical fire weather designation preceded that warning by an additional day. Both are archived and retrievable.
The forensic meteorologist’s role is to establish this verified atmospheric timeline with full source citation. Sounding-derived stability, mixing height, and transport wind can help evaluate plume behavior and smoke movement; fire spread rate still requires fuels, slope, wind exposure, fuel moisture, and observed fire progression (University of Wyoming radiosonde archive; USDA Forest Service NFDRS documentation).
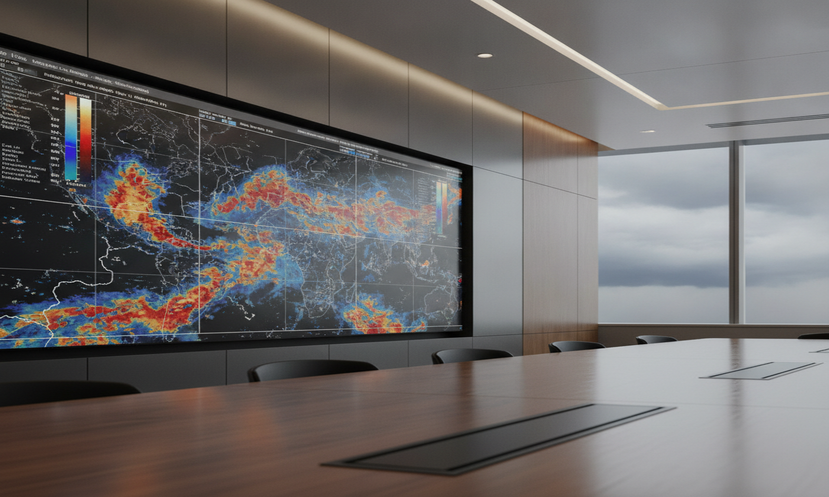
How Does a Forensic Meteorologist Translate Atmospheric Data Into Courtroom Exhibits?
Raw atmospheric data communicates nothing useful to a judge or jury without expert translation. A forensic meteorologist converts RAWS hourly observations, HYSPLIT trajectory output, GOES satellite imagery, and EPA AQS PM2.5 time series into fully sourced visual exhibits that are simultaneously scientifically defensible and visually accessible (NOAA NCEI; EPA AQS; NOAA ARL READY).
Common wildfire litigation exhibits include:
- Annotated RAWS timeline charts showing the hour-by-hour progression of wind gusts, relative humidity decline, and fuel moisture from before ignition through peak fire behavior
- HYSPLIT trajectory maps overlaid on county-level street maps showing the hourly pathway of smoke from fire origin to disputed receptor locations
- GOES satellite image sequences at 10-minute intervals showing fire plume development and smoke spread
- NWS warning timeline graphics aligning Red Flag Warning issuance, SPC outlook upgrades, fire ignition, evacuation order issuance, and known property damage timestamps on a single horizontal axis
- EPA AQS PM2.5 time-series charts overlaying observed monitor readings with the AQI health threshold lines at 101, 150, 200, and 300
Each exhibit must be fully sourced with archive URL citations and data retrieval timestamps. In deposition and at trial, opposing counsel will demand the data provenance behind every graphic. A forensic meteorologist who cannot produce the specific archive URL, the station identifier, the download date, and the QA/QC status of every input dataset is vulnerable to a Daubert challenge.
Is Wildfire Smoke Litigation Limited to the Western United States?
No. Canadian wildfire smoke in 2023 and 2024 produced AQI readings above 200 across the Great Lakes, Mid-Atlantic, and Southeast, creating potential respiratory exposure claims in states with no active wildfire conditions. In the Mid-South, NWS Memphis (WFO MEG) documented smoke transport events that exceeded Unhealthy AQI thresholds at KMEM (Memphis International ASOS) during recent fire seasons (NOAA NCEI ISD; EPA AQS).
The emerging wildfire threat in the Southeast is documented in the NIFC May through August 2026 Predictive Services outlook, which notes long-term La Nina drought leaving fuels parched from Virginia to Florida. RAWS station coverage in the Southeast is growing. NWS offices across the region issue Red Flag Warnings. The NOAA HMS product provides the same satellite-based smoke extent documentation for southeastern fire events as it does for California fires.
A forensic meteorologist applying NOAA-standard methodology uses the same analytical framework regardless of geographic region. The federal datasets are national in scope. The data provenance protocol does not change with geography.
What Daubert Standards Apply to Fire Weather and Smoke Dispersion Testimony?
Under Federal Rule of Evidence 702, as interpreted by Daubert v. Merrell Dow Pharmaceuticals, Inc., 509 U.S. 579 (1993), and extended to technical expert testimony by Kumho Tire Co. v. Carmichael, 526 U.S. 137 (1999), a trial court must determine that expert testimony rests on sufficient facts or data, employs reliable methodology, and applies that methodology reliably to the specific case facts. The 2023 amendments to FRE 702 explicitly codified that the expert’s opinion must reflect a reliable application of methodology to the facts.
For fire weather and smoke dispersion testimony, these standards create concrete documentation requirements. Every meteorological opinion must be traceable to a named, independently archived dataset. HYSPLIT runs must be documented with the specific input meteorological dataset (NAM, GDAS, or HRRR), the release height, the run parameters, and the retrieval date of the meteorological archive files. RAWS observations must be cited by station name, station identifier, and the specific WRCC or IEM archive URL. AQS PM2.5 readings must be cited by monitor site ID, parameter code, and the specific retrieval period (FRE 702; Daubert; Kumho Tire).
Experts who rely on third-party commercial weather history products face a structurally different challenge. Proprietary weather databases are not independently archived in federal repositories, are not subject to the QA/QC protocols required of NWS ASOS or RAWS data, and their reconstruction algorithms are typically not peer-reviewed or publicly disclosed. Federal archive data from NOAA and EPA sidesteps these challenges because those datasets are produced by the agencies that set the scientific standards to which all expert testimony is compared.
Methods and Sources
Remote Automated Weather Station (RAWS) Data
National Interagency Fire Center (raws.nifc.gov); Western Regional Climate Center (wrcc.dri.edu); WIFIRE Commons (wifire-data.sdsc.edu). Approx. 2,200 stations; 10-minute records. Wind at 6 m (20 ft); temp/RH at 2 m.
NEXRAD Level II WSR-88D Archive
NOAA NCEI (ncei.noaa.gov/products/radar). Base Reflectivity, Velocity, VAD Wind Profile. Site IDs: KVTX (Ventura CA), KNKX (San Diego CA), KNQA (Shelby County TN). Beam-height, terrain blockage, range, and representativeness documented per report.
ASOS/AWOS Surface Observations
Iowa Environmental Mesonet (mesonet.agron.iastate.edu) and NOAA NCEI ISD. METAR/SPECI plus 1-minute ASOS where available (NCEI/IEM). AWOS 1-minute archives not uniformly available; network-dependent.
NWS Warning Products and SPC Fire Weather Outlooks
IEM archive (mesonet.agron.iastate.edu); SPC archive (spc.noaa.gov/products/fire_wx). Red Flag criteria locally defined by NWS WFO and state fire-weather operating plan.
Upper-Air Sounding Data
University of Wyoming (weather.uwyo.edu/upperair). Standard release times 0000 and 1200 UTC.
NOAA HYSPLIT Model
NOAA ARL READY Archive (ready.noaa.gov; arl.noaa.gov/hysplit). Reference: Stein et al. (2015). Driving meteorology: NAM, GDAS, or HRRR fields. Concentration outputs require emissions assumptions and observational corroboration.
NOAA HRRR Model
3-km resolution, hourly cycles. Archive: NOAA NCEI (rapidrefresh.noaa.gov/hrrr). Initialization time, forecast hour, grid point, and limitations cited per value.
NOAA/NESDIS HMS Fire and Smoke
ospo.noaa.gov/Products/land/hms.html. VIIRS (375 m) and MODIS (1 km) fire detection. Satellite fire activity and smoke extent; not a substitute for official incident perimeter data.
NOAA GOES Archive
NOAA CLASS (class.noaa.gov). GOES-16 and GOES-18; 10-minute scan interval.
EPA AQS Monitoring Data
aqs.epa.gov. PM2.5 parameter code 88101; PM10 parameter code 81102. Cited by monitor ID, averaging period, QA status, and retrieval date. AirNow for situational context only; official records from AQS.
Legal Standards Referenced
Federal Rule of Evidence 702 (2023 amendments); Daubert v. Merrell Dow Pharmaceuticals, 509 U.S. 579 (1993); Kumho Tire Co. v. Carmichael, 526 U.S. 137 (1999); EPA NAAQS PM2.5, 40 C.F.R. Part 50; NWCG 2025 Haines Index Discontinuation Guidance; NFDRS, USDA Forest Service.
About the Author
John Bryant is an AMS-, NWA-, and EPA-certified forensic meteorologist and expert witness based in Memphis, Tennessee, specializing in weather reconstruction for slip-and-fall, wind, hail, wildfire, and ice-storm litigation. He holds more than 30 years of experience in weather analysis, reconstruction, and expert witness testimony, and is recognized as one of the few meteorologists worldwide to hold concurrent AMS, NWA, and EPA certifications.
Mr. Bryant provides forensic weather reconstruction and authoritative expert testimony for high-stakes litigation on behalf of both plaintiff and defense. He previously served as Chief Meteorologist at an ABC affiliate station in Memphis for over a decade, where he directed a professional meteorological team and worked with regional emergency management during severe weather events including hurricanes, tornadoes, and winter storms. He holds a B.S. in Geosciences with an emphasis in Meteorology and Atmospheric Science from Mississippi State University.
You can email John HERE
Work With a Forensic Meteorologist on Your Wildfire Case
If you are evaluating a wildfire, smoke damage, or fire weather liability matter, a preliminary case review can establish whether the meteorological record supports your theory of the case. Contact John Bryant