Oregon Weather Expert Witness: Forensic Meteorologist John Bryant
BOTTOM LINE UP FRONT
A forensic meteorologist reconstructs Oregon weather conditions for civil litigation using NOAA-archived observations, NEXRAD Level II radar, and Oregon mesonet data. Hourly rates run $200–$500 depending on case complexity and credentials. Pacific Northwest weather requires regional fluency: the Columbia Gorge funnels east winds past 60 knots; Willamette Valley ice storms accrete over 1 inch of ice in a single event (Feb 11–14, 2021 storm produced 350,000+ peak Portland General Electric outages); Cascade orographic gradients produce 100-inch annual snowfall differences within 30 miles. Oregon courts evaluate expert testimony under OEC 702 and the State v. Brown / State v. O’Key framework, not the federal Daubert test as a stand-alone checklist.
If you’re looking for an Oregon weather expert witness, forensic meteorologist John Bryant provides weather reconstruction and testimony for attorneys across the state.
Oregon Forensic Meteorology: Quick Reference
| Service Area | Oregon statewide, Coast, Willamette Valley, Cascade Range, High Desert, Blue Mountains, Columbia Gorge |
| Evidentiary Framework | Oregon Evidence Code (OEC) 702; State v. Brown, 297 Or 404 (1984); State v. O’Key, 321 Or 285 (1995); Marcum v. Adventist Health System/West, 345 Or 237 (2008) |
| Primary Data Sources | NOAA NCEI archive · NWS Portland (KPDX), Pendleton (KPDT), Medford (KMFR) · ASOS/AWOS network · Oregon Climate Service mesonet · NEXRAD WSR-88D (KRTX, KMAX, KPDT) |
| Hourly Rate Range | $200–$500/hour (research, deposition, trial, tier varies by complexity) |
| Typical Case Types | Slip-and-fall (ice/freezing rain), vehicle accidents (fog/hydroplaning), wind damage, flooding, construction delay, wildfire, wrongful death |
| Regional Specialization | Pacific marine layer, Cascade orographics, Gorge wind events, atmospheric rivers, Willamette Valley cold-air pooling |
| Turnaround | Preliminary review within 48 hours; full report 7–10 business days |
Why Oregon Attorneys Hire a Regional Forensic Meteorologist
Oregon weather creates liability questions that generic, app-based data cannot resolve. The Pacific marine layer drops coastal visibility below a quarter mile. The Cascade Range produces orographic precipitation gradients of 100 inches or more across 30 miles of horizontal distance. The Willamette Valley traps shallow Arctic air beneath warmer Pacific flow, producing freezing rain when surface temperatures sit between −2°C and +2°C. East of the Cascades, the High Desert routinely swings 40°F to 50°F between dawn and afternoon.
Consumer weather apps interpolate from distant model grids; they do not capture these microclimates. A defensible weather reconstruction for Oregon courts begins with site-specific station data, Portland International (KPDX), Eugene (KEUG), Pendleton (KPDT), Redmond (KRDM), Medford (KMFR), and dozens of cooperative observer (COOP) and Oregon Climate Service mesonet sites. The difference matters. A plaintiff claims she slipped on ice at 8:15 AM in downtown Portland. The defendant’s phone app shows 38°F; the KPDX ASOS METAR for 1515Z shows 31°F with freezing drizzle (−FZDZ) coded on the surface observation. That 7-degree gap, archived in a federal database with quality flags and sensor metadata, is the difference between a defensible reconstruction and a screenshot.
A retained forensic meteorologist also supplies the piece attorneys can rarely build alone: chain-of-custody documentation for every data point, retrieval timestamp, source archive, query parameters, and, on request, file-level checksums. Without that scaffolding, individual weather records sit on the same evidentiary footing as a forwarded text message.
Evidence and Methods: How Weather Reconstruction Works
ASOS, AWOS, COOP, and Oregon Mesonet Networks
Automated Surface Observing System (ASOS) and Automated Weather Observing System (AWOS) stations form the spine of forensic surface analysis. Oregon hosts dozens of ASOS/AWOS sites at FAA-jurisdiction airports plus NWS-maintained installations. METAR observations are archived in the NOAA NCEI Integrated Surface Database (ISD) with UTC timestamps and per-element quality control flags.
Worked example, slip-and-fall in Bend, Oregon, 0730 PST on December 5, 2024. The expert pulls METAR data from Roberts Field (KRDM), 16 miles north:
KRDM 051530Z 27008KT 1/2SM SN BKN008 OVC015 M02/M04 A3012
Decoded: wind 270° at 8 kt; visibility one-half statute mile in snow; broken ceiling 800 ft, overcast 1,500 ft; temperature −2°C; dew point −4°C; altimeter 30.12 inHg. Every field is a verifiable, archived data point with documented sensor metadata.
The Oregon Climate Service mesonet, operated by Oregon State University, fills rural gaps and measures parameters airports do not, soil moisture, leaf wetness, solar radiation. For agricultural, forestry, or premises cases far from airports, these stations supply the hyperlocal data. NWS Cooperative Observer (COOP) sites add daily precipitation and temperature records dating back decades.
NEXRAD WSR-88D Radar Coverage
Oregon is covered by Next Generation Weather Radar (NEXRAD) sites KRTX (Portland), KMAX (Medford), and KPDT (Pendleton) within state, plus adjacent radars in Boise (KCBX), Langley Hill, Washington (KLGX), and Camano Island/Seattle (KATX) where coverage overlaps. WSR-88D radars complete a volume scan every 4 to 6 minutes and operate in dual-polarimetric mode, providing base reflectivity (Z), base velocity (V), differential reflectivity (ZDR), correlation coefficient (ρHV), and specific differential phase (KDP). Level II archive data is preserved at NCEI.
For a hydroplaning crash on I-5 near Albany at 1545 PST on February 14, 2025, KRTX returned 50–60 dBZ reflectivity over the crash location at 2345Z. Applying the convective Z–R relationship Z = 300R1.4, the instantaneous rate falls in the 1.5–2.0 in/hr range. Where standing water on the pavement is in question, the expert combines that rate with antecedent precipitation, surface drainage characteristics, and ODOT pavement specifications, none of which a weather-app screenshot can supply.
Synoptic and Upper-Air Context
Surface observations alone rarely explain an event. Oregon weather is driven by Pacific moisture, the Cascade barrier, and episodic Arctic intrusions. Upper-air soundings from Salem (KSLE, WMO 72694) and Medford (KMFR, WMO 72597) anchor the vertical profile. Reanalysis products, NAM, RAP, HRRR, fill spatial and temporal gaps. NOAA Weather Prediction Center surface analyses and SPC mesoscale archives provide the synoptic narrative.
Willamette Valley ice storms have a textbook setup: warm, moist Pacific air aloft (700-mb temperatures above 0°C) overrunning a shallow Arctic cold pool trapped beneath the Cascade-to-Coast Range topography, with easterly flow through the Columbia River Gorge. The February 11–14, 2021 Portland ice storm is the recent benchmark: NWS storm reports documented approximately one inch of ice accretion in the central Willamette Valley (1.5 inches near Oregon City). Portland General Electric reported peak outages of more than 350,000 customers and over 420,000 total customers affected across the multi-day event, the largest weather-driven outage in Oregon utility history.
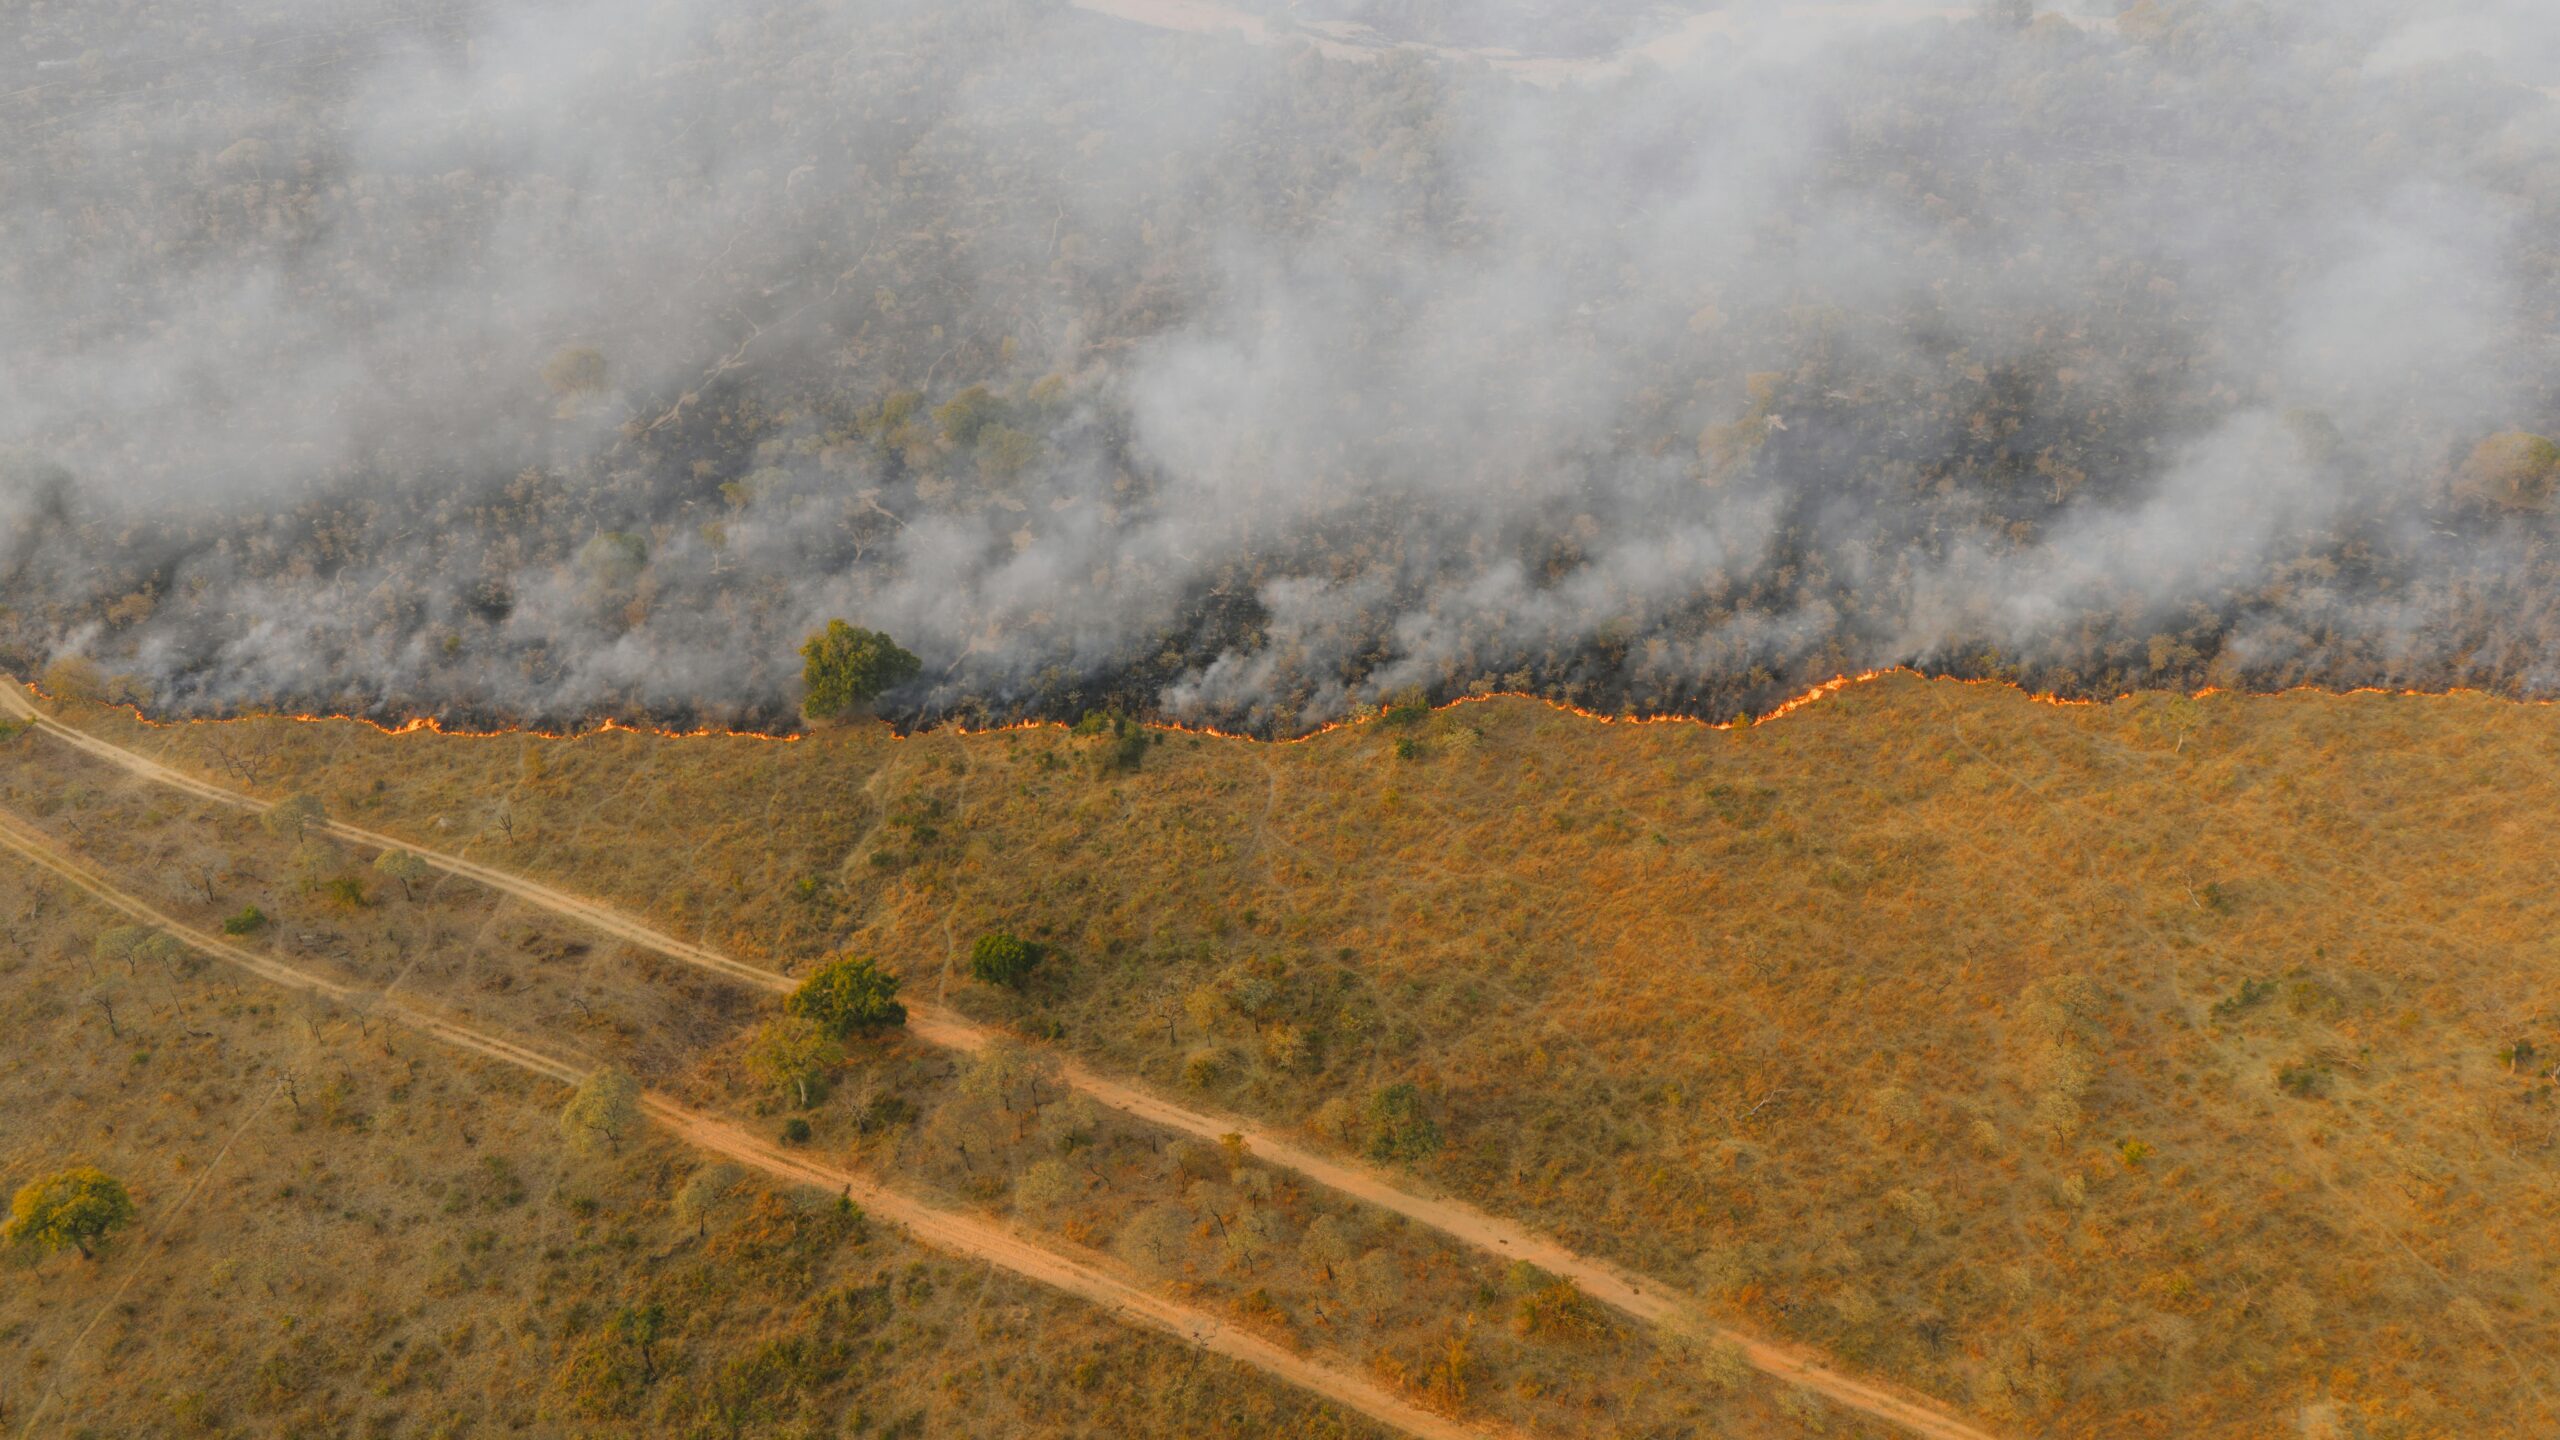
Wildfire and smoke litigation requires a different toolkit: Energy Release Component (ERC), Haines Index, and Keetch–Byram Drought Index (KBDI), combined with sustained wind, relative humidity, and National Lightning Detection Network (NLDN) strike data. The September 2020 Labor Day fires across western Oregon recorded sustained easterly winds of 40–50 mph, relative humidity below 15%, and ERC values at the upper end of the historical distribution, a combination directly attributable to the synoptic pattern.
Chain of Custody and Data Provenance
Every data file pulled for an Oregon case is logged with the retrieval timestamp, the source archive URL, the query parameters, and, on request, an MD5 or SHA-256 checksum. A typical provenance line reads: “KPDX METAR retrieved from NOAA NCEI Climate Data Online interface on 2025-01-15 at 1430 UTC; date range 2024-12-01 through 2024-12-31; format CSV; MD5 = 8e2e7f7c7a5b6d4e3f2a1b0c9d8e7f6a.” Quality control follows ISD QC procedures, missing values coded −9999, suspect values flagged against climatology and adjacent stations, sensor maintenance histories pulled where available. For coastal stations, known siting concerns (salt-spray contamination of anemometers) are disclosed and corroborated against neighboring sites.
For current forecasts and warnings, see the NOAA National Weather Service Portland office
Long-term climate context is available from the Oregon Climate Service, the state’s official climate office
https://blogs.oregonstate.edu/occri/oregon-climate-services/
Oregon’s Four Weather Regimes: Forensic Implications
1. Coastal Fog and the Marine Layer
From April through September, marine air pushes onshore and visibility along Highway 101 can collapse below 0.125 statute miles within minutes. Coastal airport observations 5+ miles inland often miss the event entirely. The forensic toolkit shifts seaward: NOAA NDBC buoy 46050 (130 nautical miles west of Newport) supplies sea surface temperature, wave height, and atmospheric pressure; GOES-18 satellite imagery captures the marine layer’s horizontal extent; coastal NWS observations from North Bend (KOTH) and Astoria (KAST) bracket the onshore push. When SST runs 50–55°F under 70–80°F land surface temperatures, a marine layer 1,000–2,000 ft thick is the expected outcome.
2. Cascade Orographic Effects
Portland International receives roughly 43 inches of precipitation annually. Timberline Lodge at 6,000 ft elevation receives more than 140 inches, much of it as snow. Construction-delay, ski-area liability, and avalanche claims require elevation-adjusted analysis, surface observations from valley airports do not represent ridge-line conditions. The expert pulls SNOTEL data from the NRCS National Water and Climate Center (Mt. Hood Test Site, Red Hill, Clackamas Lake), PRISM gridded climate normals from the Oregon Climate Service, and pass-level observations from Santiam Pass, Willamette Pass, and Government Camp. Temperature lapse rates and freeze-thaw counts are computed for the site elevation, not the valley.
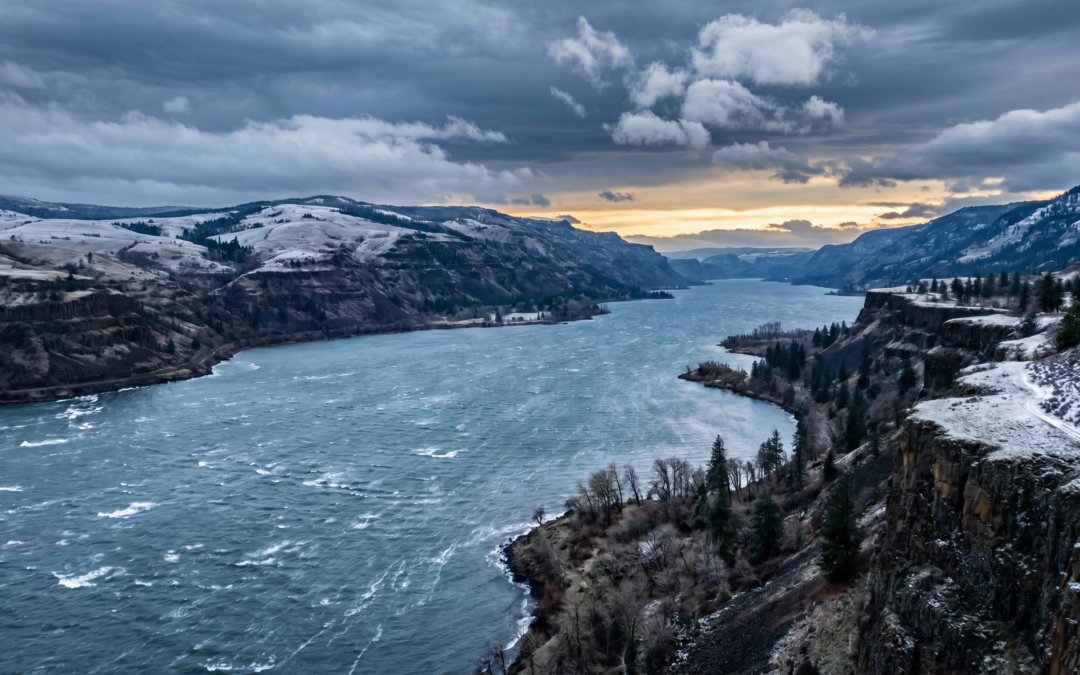
3. Columbia River Gorge Wind Events
The Gorge functions as a wind tunnel between the Cascade Range and the Pacific. Sustained 30–50 mph flow with gusts past 60 knots is routine; direction signals season, easterly outflow in winter under cold-air damming, westerly in summer under thermal gradient. Wind-damage reconstruction in this corridor draws on observations from The Dalles Municipal Airport (KDLS) at the east end, Ken Jernstedt Airfield (FAA LID 4S2 / pseudo-ICAO K4S2) at Hood River with on-field AWOS (frequency 134.375), and Portland-Troutdale (KTTD) at the west end. A claimed roof failure in Hood River on January 8, 2024, with 4S2 AWOS reporting east winds gusting to 58 kt at 1015Z, is then weighed against ASCE 7-22 design wind speeds for the relevant Risk Category and the building’s construction-vintage code (older structures may be designed under ASCE 7-05 or earlier thresholds).
4. High Desert Extremes East of the Cascades
Bend, Klamath Falls, and Burns see summer highs near 100°F and winter lows in the negative teens. Diurnal range frequently exceeds 40°F. Solar irradiance at 4,000+ ft elevation accelerates surface heating and material fatigue. Product-liability and pavement-failure cases require freeze-thaw cycle counts (days with both max above 32°F and min below 32°F), site-specific solar radiation series from mesonet pyranometers, and soil temperature records. Cumulative freezing degree days are then matched against manufacturer cold-weather performance specifications.
Oregon’s Evidentiary Framework for Expert Testimony
Oregon does not apply the federal Daubert test as a stand-alone five-factor checklist. Admissibility of scientific and technical expert testimony is governed by Oregon Evidence Code (OEC) 702, interpreted through the Oregon Supreme Court’s decisions in State v. Brown, 297 Or 404, 687 P.2d 751 (1984), and State v. O’Key, 321 Or 285, 899 P.2d 663 (1995), and refined in subsequent cases including Marcum v. Adventist Health System/West, 345 Or 237 (2008). In O’Key, the Oregon Supreme Court treated Daubert as “instructive, but not determinative”, Oregon courts may consider Daubert factors alongside the seven factors enumerated in Brown.
The Brown factors that Oregon trial courts may weigh in evaluating proffered scientific evidence are:
- The technique’s general acceptance in the field;
- The expert’s qualifications and stature;
- The use which has been made of the technique;
- The potential rate of error;
- The existence of specialized literature;
- The novelty of the invention;
- The extent to which the technique relies on the subjective interpretation of the expert.
The Oregon Supreme Court has emphasized that these factors are not a “mechanical checklist.” As the court wrote in O’Key: “What is important is not lockstep affirmative findings as to each factor, but analysis of each factor by the court in reaching its decision on the probative value of the [proffered scientific] evidence under OEC 401 and OEC 702.” Oregon trial courts function as gatekeepers, balancing OEC 401 relevance, OEC 702 helpfulness, and OEC 403 prejudice considerations.
For atmospheric science specifically, the underlying methods, surface observation, radar interrogation, sounding analysis, climatology, are long-established and grounded in peer-reviewed literature, including the AMS journals Weather and Forecasting, Journal of Applied Meteorology and Climatology, and Bulletin of the American Meteorological Society. Sensor error budgets are documented: ASOS temperature ±0.5°C, wind speed ±1 kt, precipitation gauges ±10–20% (higher for frozen precipitation). These are factual inputs to a Brown/O’Key analysis; how a trial court weighs them in any specific case is for that court to decide.
Cost Structure for Oregon Engagements
Tier 1: Basic Analysis ($200–$300/hr)
Straightforward facts with nearby airport coverage. Includes NCEI data retrieval, written weather summary, and a short opinion letter. Suitable for slip-and-fall cases with documented snow or ice, vehicle accidents with airport-confirmed fog, and construction delays with daily precipitation records.
Tier 2: Complex Analysis ($300–$400/hr)
Cases requiring radar interrogation, mesoscale interpretation, mesonet/buoy/SNOTEL integration, or deposition support. Wind-damage reconstruction along the Columbia Gorge, coastal-fog accident analysis, and atmospheric-river flood cases typically fall in this tier.
Tier 3: Trial Testimony ($400–$500/hr)
Deposition, trial appearance, demonstrative exhibit production, and rebuttal of opposing experts. Reserved for high-value premises, wrongful death, complex construction, and mass-tort atmospheric exposure cases.
Additional cost items: travel mileage reimbursed at the prevailing IRS standard business rate (72.5 cents per mile for 2026, up from 70.0 cents in 2025), deposition attendance (half-day minimum), trial time (full-day minimum plus preparation), and exhibit production (radar loops, surface analyses, animations). Rush turnaround within 48 hours adds a 50% surcharge. Retainers typically equal 10–20 billable hours, with monthly invoicing thereafter.
Typical Oregon case budgets: $3,000–$5,000 for basic analysis (15–20 hours), $8,000–$15,000 for complex analysis (30–40 hours), $20,000–$40,000 for full trial engagement including rebuttal and exhibits.
Practical Implications for Oregon Counsel
Engage early. Many data streams are time-sensitive. NWS Level II radar archives at full resolution at NCEI, but some private sensor networks overwrite within days. ODOT roadway and camera footage retention is finite (commonly 30–60 days). Earlier engagement preserves the strongest evidentiary picture.
Secure site-specific sources. Airport observations may not represent conditions 10–20 miles away. Beyond ASOS/AWOS, identify nearby mesonet stations, SNOTEL sites, COOP observers, USGS stream gauges, and any municipal or agricultural weather networks operating in the incident vicinity.
Account for microclimate uncertainty. Reconstruction has inherent error. A station five miles away under different terrain may not have experienced identical conditions. The expert quantifies that uncertainty and reports it explicitly, high confidence (two or more independent sources agreeing within sensor error), medium (partial agreement or moderate spatial extrapolation), low (sparse data or reliance on model output).
Expect opposing experts. In contested cases, opposing counsel will retain a competing meteorologist. Methodological disagreement is normal, differences in spatial extrapolation, quality-control handling of suspect values, and climatological framing. Transparent data sourcing and disclosed assumptions are the durable answer.
Regional fluency matters. A Gulf Coast hurricane specialist is not, by default, a Cascade ice-storm specialist. When vetting a candidate weather expert witness for Oregon cases, ask about Columbia Gorge wind events, atmospheric rivers, Cascade pass observations, SNOTEL workflow, and prior testimony in Pacific Northwest courts.
Applications by Practice Area
Premises Liability: Slip-and-Fall Weather Expert Oregon Cases
Reconstruct ice formation timing relative to business operating hours and documented maintenance activity. Distinguish freezing rain, refrozen snowmelt, and black ice using surface temperature, dew point, and antecedent precipitation. Compare onset against any NWS Winter Weather Advisory, Ice Storm Warning, or Special Weather Statement in effect.
Motor Vehicle Accidents
Visibility reconstruction (fog, dense precipitation, blowing snow); rainfall-rate calculation and hydroplaning analysis from radar reflectivity; wind reconstruction for truck rollover and trailer-sway; surface temperature analysis for bridge-deck ice formation on Cascade pass crossings and Gorge bridges.
Construction Defect and Delay
Workable-day calculation against rain, snow, temperature, and wind thresholds. Cold-weather concreting analysis under ACI 306 (“Guide to Cold Weather Concreting”), the standard treats cold weather as conditions where air temperature has fallen to or is expected to fall below 40°F during the protection period; recommended minimum fresh-concrete placement temperature is approximately 55°F for thin sections, with protection maintained until in-place strength reaches roughly 500 psi. Roofing-work stoppages are evaluated against manufacturer wind-speed specifications. Excavation and foundation work delays draw on soil temperature, antecedent precipitation, and frost depth.
Property Damage: Wind, Hail, Flood
Peak wind reconstruction against ASCE 7-22 design thresholds and prior code editions. Hail-size estimation from dual-polarimetric NEXRAD signatures (ZDR, ρHV) and the MESH algorithm, ground-truthed against rain-gauge and storm-spotter reports. Flood reconstruction using radar QPE, NOAA Atlas 14 return-period precipitation, USGS NWIS stream gauges, and National Water Model output.
Frequently Asked Questions: Oregon Weather Expert Witness
What qualifications should an Oregon weather expert witness have?
A qualified Oregon weather expert witness should hold at minimum a bachelor’s degree in meteorology, atmospheric science, or a closely related field from an accredited program. Professional credentials carry weight under OEC 702, American Meteorological Society (AMS) certifications, National Weather Association (NWA) Seals of Approval, and EPA-related certifications where applicable. Regional fluency matters: prior work with Pacific Northwest patterns (marine layers, orographic precipitation, ice storms, Columbia Gorge wind events) and familiarity with Oregon-specific data sources, Oregon Climate Service mesonet, SNOTEL, coastal NDBC buoys, and ODOT roadway weather information systems.
How much does it cost to hire a weather expert witness for an Oregon case?
Hourly rates range from $200 to $500 depending on credentials and the complexity of the work. Basic analyses (slip-and-fall with nearby airport coverage) run $200–$300/hr. Complex work requiring radar interrogation, mesoscale modeling, or specialized data sources runs $300–$400/hr. Deposition and trial testimony is typically $400–$500/hr. Total budgets generally fall between $3,000 (basic) and $40,000 (full trial engagement including rebuttal and exhibits).
Can smartphone weather-app data be relied on in Oregon litigation?
Smartphone apps and personal-station aggregators generally lack the quality-control and chain-of-custody documentation that an OEC 702 analysis under Brown/O’Key typically expects. Apps interpolate from gridded model output or distant airport data, round values, and rarely document sensor calibration or maintenance. NOAA-archived ASOS/AWOS, COOP, and mesonet data, with documented quality flags and known sensor error budgets, are the more defensible foundation. Whether any specific data source is admissible in a given case is for the trial court to determine.
How far can airport weather data be extrapolated for Oregon incidents?
Within roughly 5–10 miles over flat terrain at similar elevation, station observations are generally robust. Beyond that, terrain, elevation, and microclimate effects increase uncertainty. In western Oregon, marine air, urban heat islands, and cold-air pooling produce real differences over short distances. In the Cascades, a 1,000–2,000 ft elevation change typically corresponds to a 3–6°F temperature change and substantial precipitation gradients. Along the coast, fog conditions one mile inland can differ markedly from observations five miles inland. The forensic answer is multiple stations, mesoscale analysis, and explicit uncertainty quantification.
What is a typical timeline for forensic weather analysis in Oregon litigation?
Initial case review and preliminary assessment: 48 hours once incident date, time, and location are provided. Comprehensive report with data analysis, graphics, and written opinion: 7–10 business days. Rush turnaround (48 hours for a full report) is available at a 50% surcharge. Deposition preparation adds 1–2 weeks; trial testimony requires 2–4 weeks of advance notice for exhibit production and scheduling. Engage as early in discovery as practical to preserve time-sensitive data streams.
Does Oregon require weather experts to hold a state license?
Oregon does not maintain a state licensing board for forensic meteorology. Unlike Professional Engineers or Land Surveyors, meteorologists are not subject to state-issued occupational licensure. Voluntary credentials, AMS certifications, NWA Seals, EPA-related certifications, and degrees from accredited atmospheric science programs, are the recognized markers of competency. Oregon courts evaluate qualifications under OEC 702 based on knowledge, skill, experience, training, and education.
When should I hire a weather expert witness for an Oregon case?
Whenever weather is a material element of liability, causation, or damages. Common scenarios: slip-and-fall with ice or snow conditions, vehicle accidents in fog or heavy precipitation, wind damage to structures, construction delay or defect claims tied to weather windows, wrongful death where conditions are in dispute, and product or pavement failures tied to thermal cycles. A short scoping call is usually enough to determine whether reconstruction will support, undermine, or simply clarify the case theory.
Three Mistakes That Weaken Oregon Weather Cases
Waiting too long to secure data. Weather data is perishable. NWS Level II radar archives at full resolution at NCEI, but private station data may overwrite within days, and ODOT camera footage retention is limited. Secure data within the first week of the incident.
Relying on unverified sources. Crowd-sourced personal weather stations, Wikipedia summaries, and amateur archives lack the quality control of NCEI-archived federal observations. Use NOAA-archived sources, certified stations, and documented networks such as the Oregon Climate Service mesonet.
Ignoring microclimate and elevation. Assuming KPDX represents conditions in Lake Oswego or the West Hills overlooks real terrain effects. A 500-ft elevation change can correspond to a 1.5–3°F temperature change and the difference between rain and freezing rain.
Technical Appendix: Methods, Stations, and Archives
Oregon NWS Forecast Offices: Portland (PQR) covering northwest Oregon, Pendleton (PDT) covering eastern Oregon, Medford (MFR) covering southern and southwest Oregon, with Boise (BOI) covering portions of far southeast Oregon.
Oregon NEXRAD Sites: KRTX (Portland/Scappoose), KMAX (Medford), KPDT (Pendleton). Adjacent coverage: KCBX (Boise), KLGX (Langley Hill, WA), KATX (Camano Island/Seattle, WA).
Key Oregon ASOS/AWOS Identifiers: KPDX (Portland Intl), KEUG (Eugene), KSLE (Salem), KMFR (Medford), KPDT (Pendleton), KRDM (Redmond/Roberts Field), KOTH (North Bend), KAST (Astoria), KBNO (Burns), KLMT (Klamath Falls), KDLS (The Dalles Municipal), KTTD (Portland-Troutdale), 4S2 / K4S2 (Ken Jernstedt Airfield, Hood River, AWOS 134.375).
Upper-Air Soundings: KSLE Salem (WMO 72694), KMFR Medford (WMO 72597). University of Wyoming sounding archive: weather.uwyo.edu/upperair/sounding.html
Archive URLs:
- NOAA NCEI Climate Data Online,
www.ncei.noaa.gov/cdo-web/ - NCEI Integrated Surface Database,
www.ncei.noaa.gov/products/land-based-station/integrated-surface-database - NCEI NEXRAD Level II archive,
www.ncei.noaa.gov/products/radar/next-generation-weather-radar - NWS storm reports (Iowa Environmental Mesonet),
mesonet.agron.iastate.edu/lsr/ - Oregon Climate Service / Oregon State University,
www.ocs.oregonstate.edu - NRCS SNOTEL,
www.nrcs.usda.gov/resources/data-and-reports/snow-and-precipitation - USGS NWIS stream gauges,
waterdata.usgs.gov/nwis - NOAA Atlas 14 precipitation frequency,
hdsc.nws.noaa.gov/hdsc/pfds/ - NDBC marine buoy data,
www.ndbc.noaa.gov
Sensor uncertainty (NWS / WMO published): ASOS temperature ±0.5°C; wind speed ±1 kt; precipitation gauges ±10–20% (higher for solid precipitation); radar QPE ±30–50%; reanalysis precipitation ±20–40%; reanalysis 2-m temperature ±2–5°F.
Confidence reporting convention: High = two or more independent sources agreeing within stated sensor uncertainty, well-sited instruments, minimal extrapolation. Medium = partial agreement, minor siting concerns, or 5–15 mile extrapolation. Low = sparse data, single source, or substantial reliance on model output.
Seven-Step Chain-of-Custody (Proof of Work)
- Define scope, incident date, time (with time zone), latitude/longitude, parameters in question.
- Inventory candidate stations, ASOS/AWOS, COOP, mesonet, SNOTEL, NDBC buoys within the relevant radius.
- Retrieve raw data, pull from NCEI / NDBC / NRCS with timestamped query logs and archive URLs.
- Quality control, apply ISD QC, flag suspect values, cross-check adjacent stations, review NWS maintenance logs.
- Spatial and vertical adjustment, lapse-rate corrections, IDW or kriging where appropriate, sounding interpolation.
- Cross-corroboration, radar QPE vs. gauge totals, satellite imagery vs. surface observations, multiple stations vs. single source.
- Uncertainty quantification and reporting, explicit confidence levels, sensitivity analysis, full provenance documentation.
Key Takeaways for Oregon Attorneys
- Oregon evaluates expert testimony under OEC 702 through the Brown/O’Key framework, not the federal Daubert test as a stand-alone checklist.
- The marine layer, Cascade orographic gradient, Columbia Gorge wind regime, and Willamette Valley ice events each require region-specific analysis.
- NOAA NCEI, NWS, Oregon Climate Service mesonet, SNOTEL, and NDBC buoy data are the defensible base.
- Hourly rates run $200–$500 depending on complexity; full trial engagements typically $20,000–$40,000.
- Engage within days of the incident, radar archives, traffic-camera footage, and private station data can age out of availability quickly.
- Every record retrieved should carry full chain-of-custody, retrieval timestamp, archive URL, query parameters, optional checksums.
Need a Weather Expert Witness for an Oregon Case?
Free initial case review. John H. Bryant, triple-certified forensic meteorologist (AMS · NWA · EPA), 30+ years of weather analysis and expert testimony for plaintiff and defense.
About the Author
John Bryant is a distinguished forensic meteorologist with 30+ years of specialized experience in weather analysis and reconstruction, as well as expert witness testimony. He holds the rare global distinction of triple certification by the American Meteorological Society (AMS), the National Weather Association (NWA), and the Environmental Protection Agency (EPA). He is recognized as one of the few meteorologists worldwide to hold all three certifications concurrently, a credential that underscores his unmatched expertise in forensic weather reconstruction and regulatory compliance.
Mr. Bryant provides authoritative expert testimony and forensic weather reconstruction for high-stakes litigation on behalf of both defense and plaintiff. He has created meteorological reports used to support legal arguments at deposition and trial, and he has served as a pivotal expert in wrongful death and personal injury cases on both sides, where his foundational meteorological analysis shaped legal strategies and case outcomes. His expert report in a two-million-dollar case involving extreme weather conditions resulted in a favorable settlement for the client.
He consults closely with legal teams to translate complex atmospheric data into clear, accessible narratives that help judges and juries understand how weather conditions affected specific facts in a case. His ability to communicate technical weather science in plain language is central to the value he brings to litigation support.
Mr. Bryant holds a B.S. in Geosciences with an emphasis in Meteorology and Atmospheric Science from Mississippi State University. He previously served as Chief Meteorologist at an ABC affiliate station in Memphis for over a decade, where he directed a professional meteorological team and worked with regional emergency management services during severe weather events, including hurricanes, tornadoes, and winter storms. He has also collaborated with a NOAA team to audit and refine AI-driven weather models, conducting rigorous assessments of predictive technologies for weather-sensitive sectors.
The author of this article is not an attorney. This content is intended as an educational resource describing forensic meteorology methods and Oregon’s evidentiary framework. Nothing in this article constitutes a legal opinion or a prediction about admissibility in any specific matter. For legal advice, consult a qualified Oregon attorney.